This article explores the fundamental distinctions between Parametric tests and Nonparametric tests in statistical analysis. Researchers often face decisions about which methods to apply based on data characteristics, underlying assumptions, and desired levels of statistical power. By examining theoretical foundations, practical applications, and real-world examples, readers will gain insight into selecting the most appropriate approach for their datasets.
Overview of Parametric and Nonparametric Tests
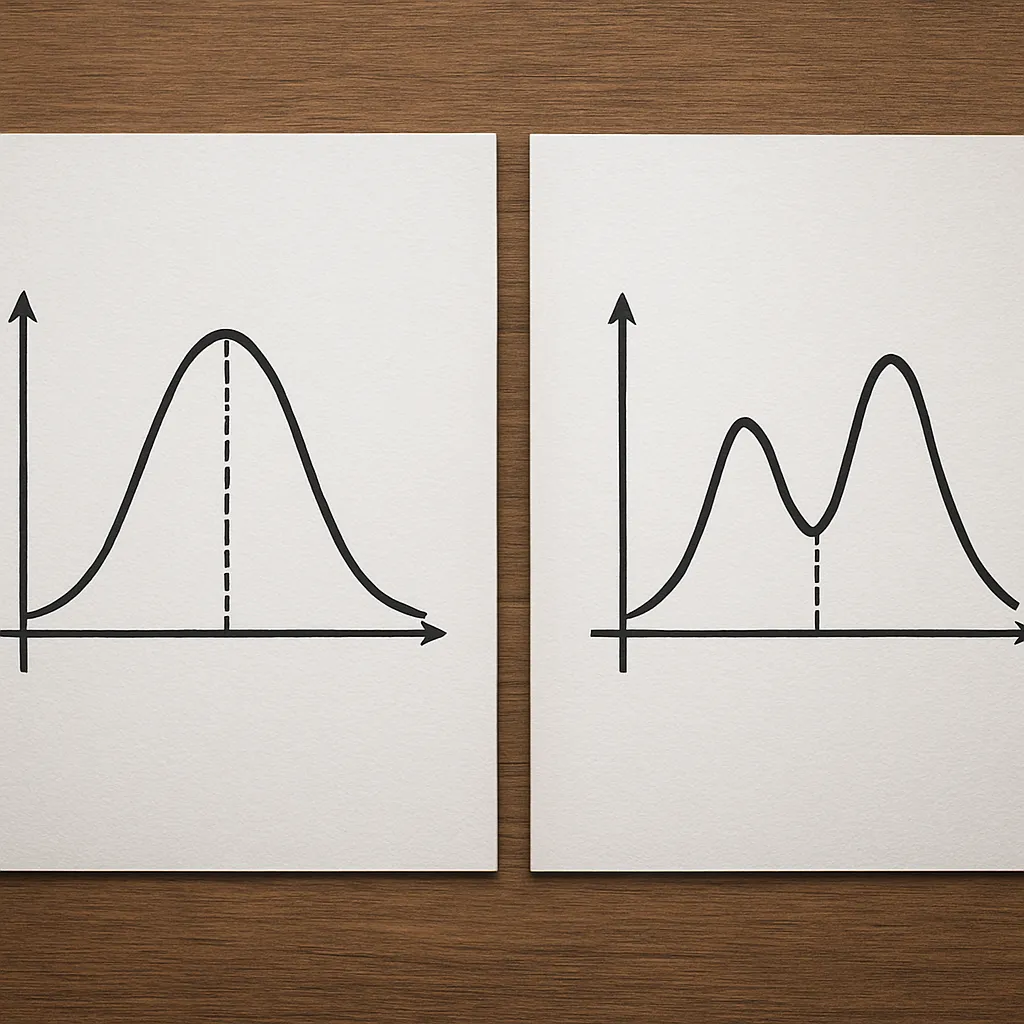
At the heart of statistical inference lies the choice between methods that rely on strict distributional assumptions and those that do not. Parametric tests assume that data originate from populations following a specific probability distribution, often the normal distribution. These techniques estimate parameters such as the mean and variance of that distribution to perform hypothesis testing. In contrast, Nonparametric tests make minimal assumptions about the population structure, relying instead on ordinal information, ranks, or other robust summaries such as the median.
The decision to employ a parametric or nonparametric approach hinges on multiple factors, including data scale, sample size, and the extent to which underlying assumptions hold in practice. In many scenarios, parametric methods provide greater sensitivity and shorter confidence intervals under ideal conditions, while nonparametric alternatives offer enhanced robustness to outliers, skewed distributions, and small samples.
Key Assumptions and Applications
Before applying any statistical test, researchers must verify critical assumptions. When these criteria are violated, results may be invalid or misleading.
- Normality: Parametric tests typically require that residuals or raw observations follow a normal distribution. Graphical checks such as Q–Q plots or formal tests like Shapiro–Wilk help assess this condition.
- Homogeneity of variance: Also known as homoscedasticity, this assumption asserts equal variance across groups or treatments. Levene’s test and Bartlett’s test are common diagnostic tools.
- Independence: Observations must be independent of one another. Violation arises in paired or clustered designs without appropriate adjustment.
- Scale of measurement: Parametric tests require interval or ratio data, whereas nonparametric tests can handle ordinal or ranked measurements.
- Sample size: As sample size decreases, the reliability of parametric assumptions weakens. Nonparametric tests often perform better with very small sample size scenarios.
Nonparametric methods do not rely on distributional form but still assume independence and comparable shapes across groups when comparing medians or ranks. They serve as versatile tools in exploratory studies, pilot experiments, or datasets with extreme skewness.
Common Parametric Tests
Parametric approaches leverage the known properties of distributions to deliver precise, parameter-based inferences. Below are some widely used methods:
t-Test
- One-sample t-test: Compares the sample mean to a known population mean.
- Independent samples t-test: Examines differences between two independent group means.
- Paired samples t-test: Assesses mean differences in matched or repeated measurements.
These tests provide high statistical power when assumptions are met, but may yield inflated Type I error if data deviate substantially from normality.
Analysis of Variance (ANOVA)
- One-way ANOVA: Tests equality of means among three or more groups.
- Two-way ANOVA: Accounts for two independent factors and their interaction.
- Repeated measures ANOVA: Handles within-subject designs over multiple time points.
Linear Regression
Models the relationship between a continuous outcome and one or more predictors. Requires normally distributed residuals, linearity, and constant variance. Extensions include multiple and polynomial regression.
Chi-Square Tests
Although often classified as nonparametric, chi-square tests for goodness-of-fit and independence assume large expected frequencies. They analyze categorical data by comparing observed versus expected counts under a specified model.
Common Nonparametric Tests
When data violate parametric prerequisites or when measurement scales are ordinal, nonparametric alternatives offer reliable inference:
Mann–Whitney U Test
Also called Wilcoxon rank-sum test, it compares two independent samples by ranking all observations and evaluating rank sums. It serves as the nonparametric counterpart to the independent samples t-test.
Wilcoxon Signed-Rank Test
Assesses paired differences through ranks, testing whether the median of differences equals zero. It parallels the paired t-test without requiring normal distribution of differences.
Kruskal–Wallis Test
Extends the Mann–Whitney approach to more than two groups. By ranking all data and comparing rank sums, it tests whether samples originate from identical populations. It is the nonparametric analog of one-way ANOVA.
Spearman’s Rank Correlation
Measures monotonic association between two continuous or ordinal variables by computing the correlation of rank-transformed values. It does not assume linearity or normality.
Permutation Tests
Construct empirical null distributions by resampling data. Permutation methods can approximate parametric tests without distributional assumptions, offering flexible robustness across diverse scenarios.
Choosing the Appropriate Test
Selecting the right statistical tool involves weighing multiple considerations. The following guidelines can aid in decision-making:
- Data distribution: If graphical or formal tests confirm near-normality, parametric tests typically yield more precise estimates and narrower confidence intervals.
- Sample size: For very small samples (n < 30), nonparametric tests may be safer due to unreliable normality assessments.
- Measurement scale: Use nonparametric methods for ordinal data or when only ranking information is meaningful.
- Presence of outliers: Nonparametric tests mitigate the influence of extreme values on test statistics.
- Research goals: When estimating specific parameters (e.g., means or regression coefficients), parametric methods are required.
In practice, analysts often perform both parametric and nonparametric versions of a test to validate findings. Discrepancies between results can highlight assumption violations or the need for data transformation.
Key Steps for Implementation
- Conduct exploratory data analysis: Visualize distributions, identify anomalies, and summarize central tendency and spread.
- Test assumptions: Use formal diagnostic tests and residual analysis.
- Select and execute the test: Choose parametric or nonparametric based on diagnostics and research objectives.
- Interpret results: Report test statistics, p-values, and effect size measures appropriate for the method chosen.
- Document decisions: Clearly communicate the rationale behind test selection, noting any deviations from ideal assumptions.