The intricate interplay between probability and statistics forms the bedrock of modern decision-making in science, engineering, and social studies. While probability offers a formal framework to quantify uncertainty before observations, statistics provides the tools to analyze data after it has been collected. Understanding how these two disciplines complement each other is essential for anyone seeking to make reliable predictions, draw meaningful conclusions, and build robust mathematical models. This article examines the foundational concepts of probability, explores the role of statistics in deciphering real-world phenomena, and highlights advanced approaches that blend these fields into cohesive analytical strategies.
Foundations of Probability
At its core, probability theory is concerned with the behavior of random variables and the likelihood of various outcomes. It begins with an abstract space of all possible events and assigns numerical values between 0 and 1 to each event, representing its chance of occurrence. Key elements of this framework include sample spaces, events, probability measures, and axioms established by Andrey Kolmogorov. These axioms ensure consistency and allow for the rigorous derivation of further theorems.
Basic Axioms and Definitions
- Sample Space: The complete set of possible outcomes of an experiment.
- Event: Any subset of the sample space to which a probability is assigned.
- Probability Measure: A function that maps events to real numbers obeying non-negativity, normalization, and countable additivity.
These foundational concepts enable practitioners to build models that describe phenomena as diverse as coin tosses, stock market fluctuations, or quantum mechanical processes. By combining probability measures with algebraic operations on events, one develops a powerful language for expressing uncertainty.
Key Probability Distributions
Probability distributions characterize how random variable values are spread across possible outcomes. Some fundamental distributions include:
- Bernoulli and Binomial for discrete experiments with two outcomes.
- Poisson for counting rare events over fixed intervals.
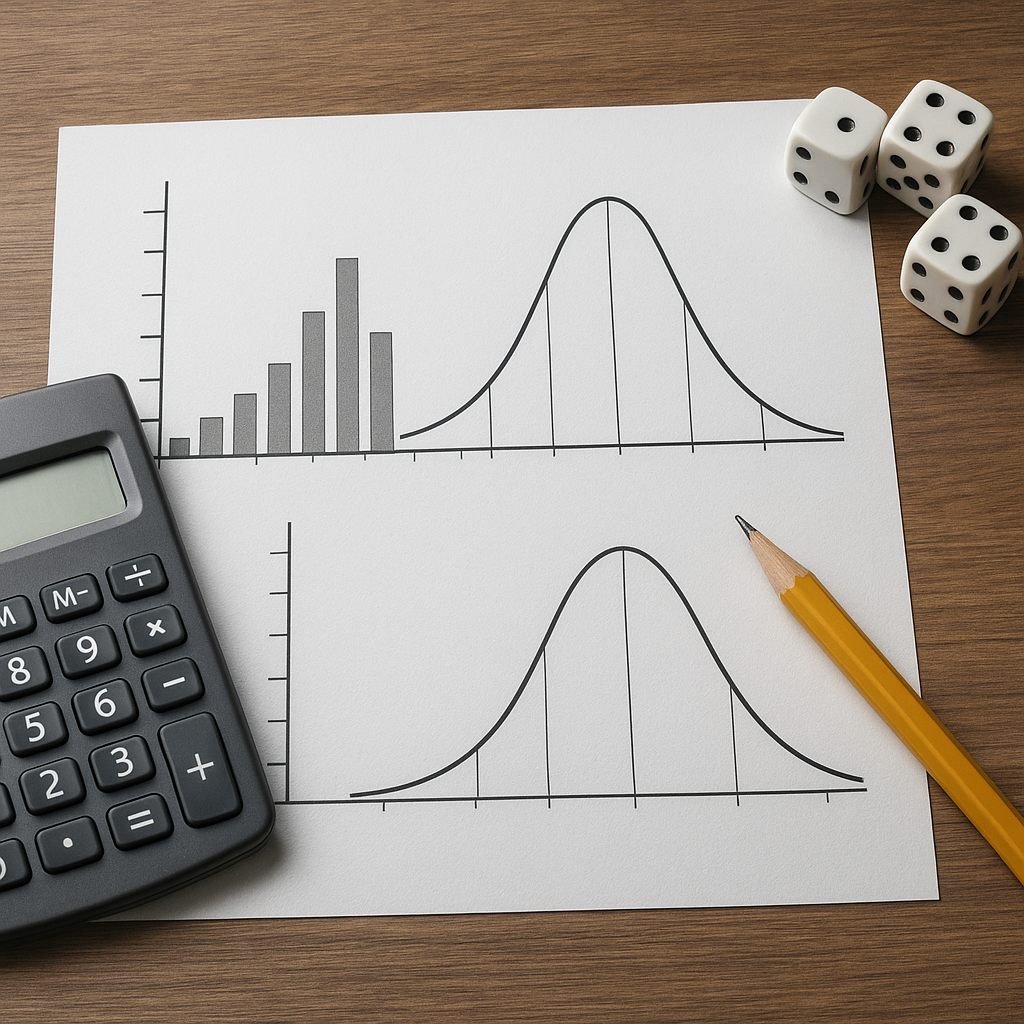
- Normal (Gaussian) for continuous data clustering around a mean.
- Exponential for modeling waiting times between independent events.
Understanding these distributions and their parameters is vital for selecting appropriate models that reflect real-world processes.
The Role of Statistics in Data Analysis
While probability offers theoretical insight into the behavior of uncertainty, statistics focuses on extracting knowledge from observed data. It transforms raw measurements into summaries, visual representations, and inferences about underlying mechanisms. Essential statistical tasks include descriptive statistics, estimation of parameters, hypothesis testing, and regression modeling. Each task builds upon probability concepts, applying them to concrete datasets to answer questions and guide decisions.
Descriptive and Inferential Methods
Descriptive statistics condense complex datasets into intuitive metrics such as mean, median, variance, and quartiles. Visual tools like histograms, box plots, and scatter plots further reveal patterns and anomalies. In contrast, inferential statistics use sample information to draw conclusions about a broader population, accounting for sampling variability and uncertainty. Common inferential methods include:
- Parameter Estimation: Techniques like maximum likelihood estimation (MLE) and method of moments.
- Confidence Intervals: Ranges of plausible values for unknown parameters.
- Hypothesis Testing: Frameworks for evaluating claims against alternative explanations.
Regression and Correlation
Regression analysis quantifies the relationship between variables, offering predictions and insights into causal links. Simple linear regression models the effect of a single covariate, while multiple regression accommodates several predictors. Correlation coefficients measure the strength and direction of linear associations. Advanced techniques such as logistic regression and generalized linear models extend these ideas to categorical responses and non-normal errors, thus broadening the applicability of statistical inference in diverse fields.
Integrating Probability and Statistical Inference
Probability theory underpins the logic of statistical inference. Before data collection, probability models specify how samples are generated under various scenarios. After observing data, statistics employs probability calculations to update beliefs about model parameters and test hypotheses. This cyclical interaction forms the basis of modern analytic workflows, where design, monitoring, and evaluation are guided by probabilistic reasoning.
Sampling Distributions and the Central Limit Theorem
The Central Limit Theorem (CLT) is a cornerstone, stating that the distribution of sample means approaches a Normal distribution as sample size grows, regardless of the original distribution. Sampling distributions describe the variability of estimators across repeated experiments and allow statisticians to approximate probabilities for complex statistics. These approximations facilitate the construction of confidence intervals and hypothesis tests rooted in probability theory.
Hypothesis Frameworks
In classical hypothesis testing, one defines a null hypothesis (H₀) representing a default position and an alternative hypothesis (H₁) capturing a specific deviation. p-values quantify the probability of observing data as extreme as those collected, given H₀ is true. By comparing p-values to significance levels (α), researchers decide whether to reject H₀. This process relies heavily on probability models of test statistics under the null scenario.
Bayesian Versus Frequentist Approaches
Two major paradigms dominate statistical inference: the frequentist and the Bayesian schools. Although both use probability, they differ in interpretation and methodology. Frequentists view probability as the limiting frequency of events in repeated trials, focusing on long-run properties of estimators. Bayesians interpret probability as a degree of belief, updating prior beliefs with observed data to obtain a posterior distribution.
Bayesian Inference
Bayesian methods revolve around Bayes’ theorem, which combines prior distributions and likelihood functions to produce a posterior distribution of parameters. This posterior encapsulates all information about unknown parameters after observing data. Advantages of Bayesian analysis include:
- Direct probability statements about parameters.
- Natural incorporation of prior knowledge.
- Flexibility in hierarchical and complex models.
Computational techniques such as Markov Chain Monte Carlo (MCMC) enable Bayesian analysis for models that lack closed-form solutions.
Frequentist Inference
Frequentist procedures emphasize estimator properties like unbiasedness, consistency, and efficiency. Confidence intervals and p-values are central tools. Though critics argue that p-values can be misinterpreted, rigorous experimental design and correct application of frequentist methods remain widespread in fields ranging from clinical trials to industrial quality control.
Real-World Applications and Future Directions
The synergy between probability and statistics drives innovation in numerous domains. In finance, stochastic models and risk assessment methods rely on probabilistic assumptions and statistical estimation to price assets and manage portfolios. In public health, the design of clinical trials and epidemiological studies demands careful statistical planning to identify significant treatment effects. Machine learning blends statistical theory with computational algorithms to derive predictive models from large-scale datasets, often employing both frequentist and Bayesian concepts.
Emerging Trends
Advances in data collection and computing power have sparked growth in areas such as:
- Big Data Analytics: Handling massive, high-dimensional datasets.
- Deep Learning: Neural network architectures informed by statistical regularization.
- Probabilistic Programming: Languages that facilitate model specification and automated inference.
- Real-time Decision Making: Integrating streaming data into adaptive probabilistic models.
Researchers continue to explore hybrid approaches, combining strengths of both paradigms to achieve more robust and interpretable results. The future of statistical science lies in developing methods that maintain theoretical rigor while adapting to evolving challenges in data-intensive environments.