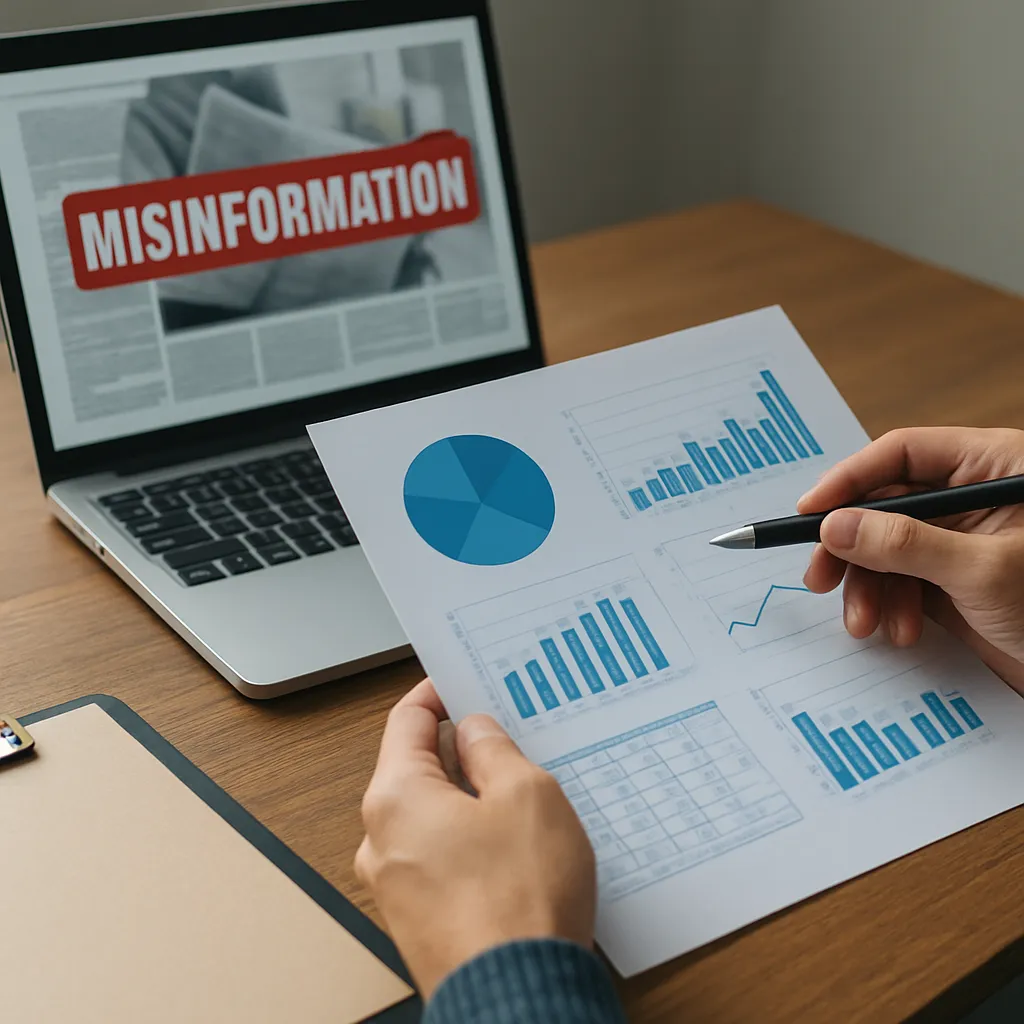
The modern information ecosystem thrives on rapid dissemination, but this speed often comes at the cost of accuracy. Researchers employ statistical tools to uncover patterns, anomalies, and deceptive signals that distinguish truth from falsehood. Understanding these methods empowers analysts, journalists, and policymakers to make informed decisions and curb the spread of harmful content.
Data Collection and Sampling Strategies
Effective detection of misleading content begins with robust data gathering. Analysts curate datasets from social media platforms, news outlets, and fact-checking websites. Ensuring representative sampling reduces bias and supports reliable inference. Common approaches include:
- Random sampling of posts to capture general trends without overemphasizing popular items.
- Stratified sampling by topic, region, or language to examine specific domains where misinformation may flourish.
- Snowball sampling for specialized networks, such as niche forums or closed groups, where deceptive narratives can propagate undetected.
Data quality checks prioritize removal of duplicates, spam accounts, and irrelevant content. Metadata such as timestamps, user interactions, and location information enrich analyses and help isolate suspicious dissemination patterns. A critical early step is formulating a clear hypothesis about how misinformation might manifest—for instance, sudden spikes in shares or uniform posting intervals by coordinated actors.
Statistical Models for Misinformation Detection
Once a clean dataset is established, various statistical frameworks come into play. Key techniques include:
- Regression analysis to identify relationships between message features (e.g., length, sentiment score) and veracity labels.
- Classification algorithms—such as logistic regression, decision trees, and random forests—that assign probability scores to each item, indicating the likelihood of false content.
- Network analysis to detect clusters of accounts acting in concert. Metrics like degree centrality and clustering coefficient reveal tight-knit groups amplifying the same narrative.
- Time-series modeling to spot abrupt changes in attention patterns, often symptomatic of automated or coordinated campaigns.
In many studies, analysts employ feature selection methods to reduce dimensionality and highlight the most predictive attributes. Measures like mutual correlation and information gain guide the choice of variables. After model training, cross-validation ensures robustness, guarding against overfitting and confirming that performance generalizes to unseen data.
Case Studies and Practical Applications
Numerous real-world investigations demonstrate the power of statistical scrutiny. In one prominent example, researchers analyzed millions of tweets around a major election. By fitting a supervised classification model, they achieved high precision in flagging automated bots disseminating false claims. Key findings included:
- Bot accounts often exhibited near-identical interpost intervals, a signal captured by an outlier detection routine.
- Engagement metrics—likes and retweets—showed a skewed distribution, with coordinated accounts inflating attention artificially.
- Geospatial clustering revealed that certain misleading narratives originated from a small set of regions before going global.
Another study focused on health misinformation during a public health crisis. Analysts used Bayesian inference to combine prior knowledge from authoritative medical sources with observed message characteristics. The resulting model assigned low trust scores to content lacking citations or trending on dubious forums. This probabilistic framework effectively filtered out content with unsupported medical claims.
Challenges and Future Directions
Despite progress, statistical detection of misinformation faces obstacles. Adversaries continually adapt, employing sophisticated language models to generate realistic text and reducing signals of coordination. Challenges include:
- High-dimensional feature spaces that demand advanced regularization techniques to prevent overfitting.
- Evolving strategies by malicious actors, requiring models to be retrained frequently to maintain efficacy.
- Ambiguity in ground-truth labels—human annotators may disagree on the veracity of nuanced statements.
Emerging directions leverage deep learning approaches combined with explainable AI to surface key evidence underlying each detection. Integration of multimodal data—text, images, and video—enhances resilience against manipulation. Additionally, collaborative platforms that share anonymized datasets and statistical findings promote transparency and collective defense.
Ethical Considerations and Responsible Use
Statistical tools wield significant power and must be applied responsibly. Analysts should be mindful of privacy implications when collecting user data and ensure compliance with relevant regulations. Transparency in methodology and open reporting of limitations prevents misuse and fosters trust. Encouraging interdisciplinary dialogue among statisticians, ethicists, and stakeholders helps strike the right balance between vigilance and free expression.
Key Terms Explained
- Algorithm: A set of rules or procedures followed in problem-solving operations, especially by a computer.
- Bias: Systematic error introduced by sampling or modeling assumptions that skews results.
- Inference: Drawing conclusions about a population based on sample data.
- Regression: A statistical technique for estimating the relationships among variables.
- Classification: Assigning items to predefined categories based on feature patterns.
- Correlation: A measure of the strength and direction of association between two variables.
- Probability: Quantitative measure of the likelihood of an event occurring.
- Data: Raw facts and statistics collected for analysis.
- Outliers: Data points that deviate markedly from other observations.
- Hypothesis: A testable statement about relationships between variables.