The margin of error plays a pivotal role in statistical studies by quantifying the uncertainty inherent in sample-based estimates. Understanding this concept enables researchers, policymakers, and analysts to gauge how closely survey results or experimental findings are likely to reflect the true characteristics of an entire population. By carefully calculating and interpreting the margin of error, one can assess the reliability and precision of conclusions drawn from data, thereby strengthening the foundations of evidence-based decision-making.
Definition and Theoretical Foundations
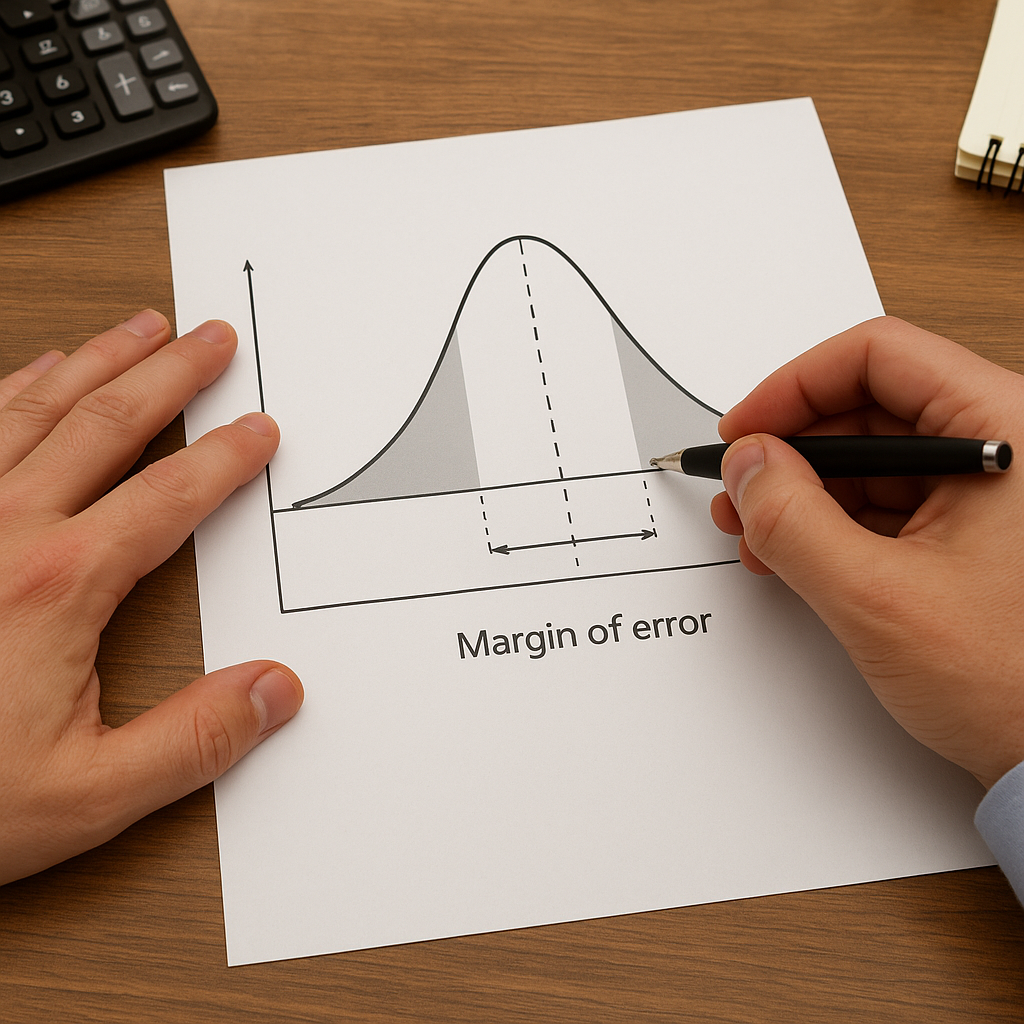
At its core, the margin of error describes a range around a sample statistic within which the true population parameter is expected to lie, given a specified confidence level. It acknowledges that any statistic derived from a sample is subject to random fluctuations that stem from the sampling process. The broader this range, the greater the uncertainty, whereas a narrower range indicates higher confidence that the estimate approximates the actual value.
Key Concepts
- Population: The complete set of individuals or observations of interest.
- Sample: A subset drawn from the population, used to infer population parameters.
- Sampling Distribution: The probability distribution of a given statistic over repeated sampling.
- Variability: The degree to which values in the sample statistic fluctuate.
- Standard Error: The standard deviation of the sampling distribution of a statistic.
These concepts converge to form the mathematical backbone for calculating the margin of error. By modeling how a statistic—such as a mean or proportion—varies across different samples, statisticians can approximate the uncertainty around any one estimate drawn from real data.
Calculating the Margin of Error
The formula for the margin of error depends on the type of parameter being estimated. For example, when estimating a population proportion (p̂), the margin of error (ME) at a given confidence level (often 95%) is typically calculated as:
ME = z* × √[p̂(1 – p̂) / n]
Here, z* represents the critical value from the standard normal distribution corresponding to the desired confidence level, p̂ is the sample proportion, and n is the sample size.
Example Calculation
- Suppose a survey finds that 60% of respondents favor a certain policy (p̂ = 0.60) with a sample size of n = 1,000.
- For a 95% confidence level, z* ≈ 1.96.
- Compute the standard error: √[0.60 × (1 – 0.60) / 1,000] ≈ 0.0155.
- Thus, ME = 1.96 × 0.0155 ≈ 0.0304 or 3.04%.
This result implies that if the survey were repeated multiple times under identical conditions, the true population proportion would lie within ±3.04 percentage points of 60% in 95% of those surveys.
Factors Affecting the Margin of Error
Several factors influence the size of the margin of error:
- Sample Size (n): Larger samples yield smaller standard error and thus a reduced margin of error.
- Confidence Level: Increasing confidence (e.g., from 95% to 99%) increases the critical value z*, widening the margin of error.
- Population Variability: Greater heterogeneity in the population increases variability in the sample statistic, enlarging the margin.
- Sampling Method: Random, well-designed sampling reduces bias and ensures the margin truly reflects random error rather than systematic distortions.
Interpreting and Applying the Margin of Error
Correct interpretation of the margin of error safeguards against overconfidence in statistical results. It is crucial to recognize that the margin of error addresses only random sampling error and does not account for biases such as nonresponse, measurement error, or flawed survey design.
Best Practices
- Always report the confidence level alongside the margin of error to convey the degree of certainty.
- Combine margin of error with other diagnostics—like response rates and demographic breakdowns—to provide context.
- Avoid comparing margins of error from studies with different sample sizes or confidence levels without proper adjustment.
- Use error bars in graphical representations to visualize the range of uncertainty around estimates.
Common Misconceptions and Limitations
It is a widespread misunderstanding that the margin of error equates to the total error in a survey. In reality, it only quantifies the component of error arising from sampling variability. Systematic errors—stemming from biased questionnaire wording or nonrepresentative sampling frames—can drastically undermine the validity of findings without affecting the formal margin of error.
Moreover, many readers misinterpret the term “margin of error” as guaranteeing that the true value lies within the interval for any single survey. Instead, the correct interpretation is frequentist: if one were to repeat the sampling process infinitely under identical conditions, the interval would capture the true parameter in the stated proportion of cases, such as 95% of surveys.
Practical Examples and Applications
Researchers across disciplines rely on the margin of error to evaluate:
- Opinion polls before elections to estimate voter preferences.
- Quality control processes in manufacturing to determine defect rates.
- Clinical trials to assess the efficacy rate of new treatments.
- Market research to gauge consumer satisfaction levels.
In each context, understanding the margin of error is essential for making informed judgments about statistical estimates, minimizing risk, and allocating resources effectively.